Shear-wave decay
It is good practice to validate the implementation of a numerical method against available analytical solutions. A particularly effective test for a fluid solver is to measure the viscosity of the simulated fluid and compare it with the viscosity that was prescribed as input. This strategy is used routinely in the lattice Boltzmann literature, for example by Fei et al. (2018) to validate the cascaded lattice Boltzmann method; see Succi (2001) for general background on the method.
The test case we use is the shear-wave decay: a sinusoidal velocity perturbation that decays in time because of viscous dissipation. Its decay rate depends only on the kinematic viscosity \(\nu\) and on the wavelength of the perturbation, both of which we control. This is the validation test of milestone 4.
Setup
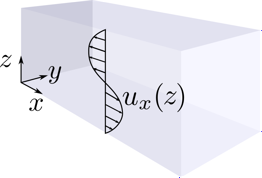
We consider a periodic two-dimensional domain of size \(L_x \times L_y\), filled with fluid of uniform density \(\rho(\mathbf{r}, t=0) = \rho_0\). On top of the quiescent fluid we impose a sinusoidal perturbation of the velocity component in the \(x\)-direction that varies along \(y\) (Figure 1), \[ \mathbf{u}(\mathbf{r}, t=0) = \begin{pmatrix} u_x(y, 0) \\ 0 \end{pmatrix} = \begin{pmatrix} \varepsilon \sin\left(\zeta y\right) \\ 0 \end{pmatrix} \quad\text{with}\quad \zeta = \frac{2\pi}{L_y}, \tag{1}\] where \(\varepsilon\) is the initial amplitude of the perturbation and \(\zeta\) its wavenumber. The amplitude \(\varepsilon\) is chosen small; we will see below why this is necessary.
Linearization: Stokes flow
The continuum limit of the lattice Boltzmann equation is the incompressible Navier-Stokes equations (see the lattice Boltzmann lecture), where \(\nu\) is the kinematic viscosity. The velocity field of Equation 1 satisfies the incompressibility constraint automatically: \(u_y = 0\) and \(u_x\) does not depend on \(x\), so \(\nabla \cdot \mathbf{u} = 0\) at all times.
For a small perturbation we can linearize Equation 2:
- The nonlinear advection term \((\mathbf{u} \cdot \nabla)\,\mathbf{u}\) is of order \(\varepsilon^2\) and can be neglected against the viscous term, which is of order \(\varepsilon\).1
- Since the density remains uniform, no pressure gradient builds up and the term \(\nabla p / \rho\) vanishes.
What remains is the Stokes (creeping-flow) limit of the momentum balance, \[ \frac{\partial \mathbf{u}}{\partial t} = \nu \nabla^2 \mathbf{u}. \tag{3}\]
Only the \(x\)-component of the velocity is nonzero, and it depends only on \(y\). Equation Equation 3 therefore reduces to a one-dimensional diffusion equation for the momentum, \[ \frac{\partial u_x(y,t)}{\partial t} = \nu \frac{\partial^2 u_x(y,t)}{\partial y^2}. \tag{4}\]
Analytical solution
Since Equation 4 is linear, a sinusoidal initial condition remains sinusoidal: only its amplitude changes in time. We therefore use the separation ansatz \[ u_x(y,t) = a(t) \sin\left(\zeta y\right) \tag{5}\] with \(a(0) = \varepsilon\). Substituting Equation 5 into Equation 4 and carrying out the spatial derivative gives \[ \frac{\mathrm{d} a(t)}{\mathrm{d} t} \sin\left(\zeta y\right) = -\nu \zeta^2\, a(t) \sin\left(\zeta y\right). \tag{6}\] The sinusoidal factors cancel, leaving an ordinary differential equation for the amplitude, \[ \frac{\mathrm{d} a(t)}{\mathrm{d} t} = -\nu \zeta^2\, a(t), \tag{7}\] whose solution is an exponential decay, \[ a(t) = \varepsilon\, e^{-\nu \zeta^2 t}. \tag{8}\]
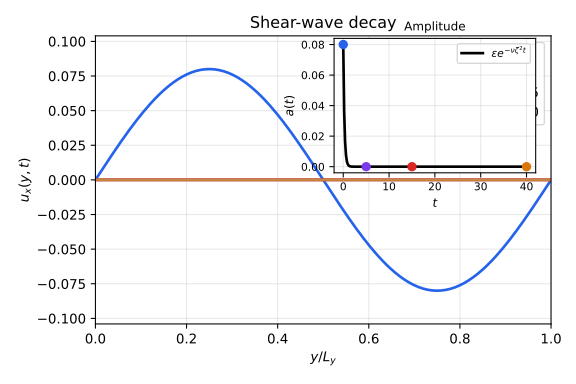
The full solution of the linearized problem is therefore \[ u_x(y,t) = \varepsilon\, e^{-\nu \zeta^2 t} \sin\left(\zeta y\right): \tag{9}\] the spatial shape of the perturbation remains a sine wave at all times while its amplitude decays exponentially with rate \(\nu \zeta^2\) (Figure 2).
Measuring the viscosity
Equation Equation 8 is the key to the validation test: the decay rate \(\nu \zeta^2\) contains the viscosity, and \(\zeta = 2\pi/L_y\) is known. The procedure is:
Run the simulation with the initial condition Equation 1 for a fixed relaxation parameter \(\omega\) and record the amplitude \(a_\text{sim}(t)\) at every time step (or every few steps). Two practical ways to extract the amplitude from the velocity field are:
- sample \(u_x\) at the maximum of the sine, i.e. at \(y^* = L_y/4\) where \(\sin(\zeta y^*) = 1\), so that \(a_\text{sim}(t) = u_x(y^*, t)\), or
- project the profile onto the sine mode (its Fourier amplitude), \[ a_\text{sim}(t) = \frac{2}{N_y} \sum_{j=0}^{N_y-1} u_x(y_j, t) \sin\left(\zeta y_j\right), \tag{10}\] where \(N_y\) is the number of lattice nodes in the \(y\)-direction. The projection is more robust because it filters out contributions from other modes.
Fit the decay. Taking the logarithm of Equation 8 gives a straight line, \[ \ln a(t) = \ln \varepsilon - \nu \zeta^2\, t, \tag{11}\] so a linear least-squares fit of \(\ln a_\text{sim}(t)\) versus \(t\) yields a slope \(m\), from which the measured viscosity follows as \(\nu_\text{sim} = -m/\zeta^2\).
Repeat and compare. Repeat the measurement for several values of the relaxation parameter, e.g. \(\omega = 0.2, 0.4, \ldots, 1.8\), and plot \(\nu_\text{sim}(\omega)\) against the analytical prediction from the Chapman-Enskog analysis (see the lattice Boltzmann lecture), \[ \nu(\omega) = \frac{1}{3}\left(\frac{1}{\omega} - \frac{1}{2}\right) \tag{12}\] in lattice units. If the implementation is correct, the measured values fall on this curve. Expect deviations to grow as \(\omega \to 2\), where the viscosity approaches zero and the scheme becomes prone to numerical instabilities.
This measurement is exactly the task of milestone 4.
Self-check
- Why must the initial amplitude \(\varepsilon\) be small? Which two assumptions of the derivation fail if it is not?
- If you double the box size \(L_y\) (keeping \(\omega\) fixed), what happens to the decay rate of the amplitude?
- What viscosity do you expect to measure for \(\omega = 1\)? What happens to \(\nu\) as \(\omega \to 2\), and why is this regime numerically delicate?
References
Footnotes
For the unidirectional profile \(\mathbf{u} = (u_x(y), 0)\) the advection term even vanishes identically. In the simulation, however, the lattice Boltzmann fluid is only weakly compressible: a large \(\varepsilon\) excites density (sound) waves that couple back into the velocity field, and the assumptions below break down. This is why \(\varepsilon\) must be kept small, in addition to the general low-Mach-number requirement \(|\mathbf{u}| \ll c_s\) of the method.↩︎