import numpy as np
import matplotlib.pyplot as plt
from scipy.integrate import solve_ivp
fig, axes = plt.subplots(1, 2, figsize=(7, 4))
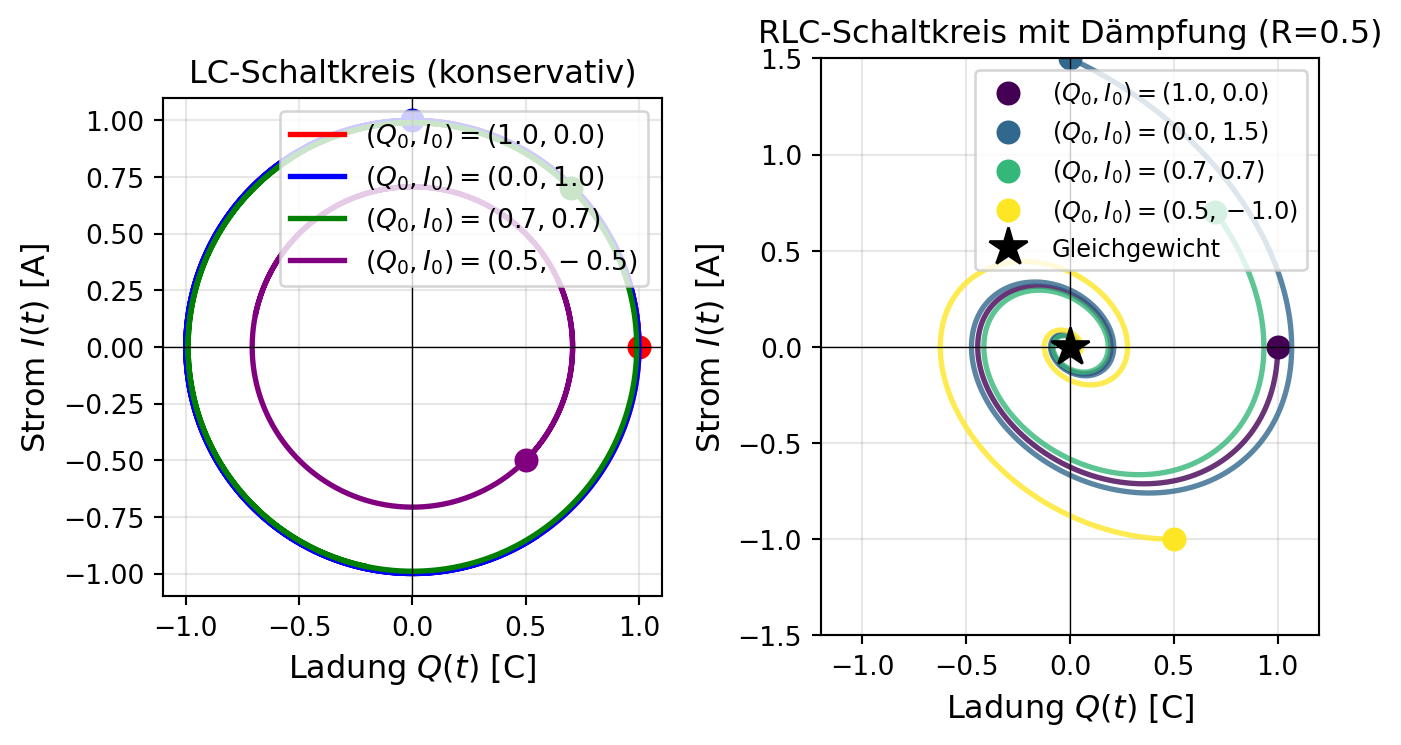
# === Linke Seite: LC-Schaltkreis (ungedämpft) ===
ax = axes[0]
L, C = 1.0, 1.0
omega_0 = 1.0 / np.sqrt(L * C)
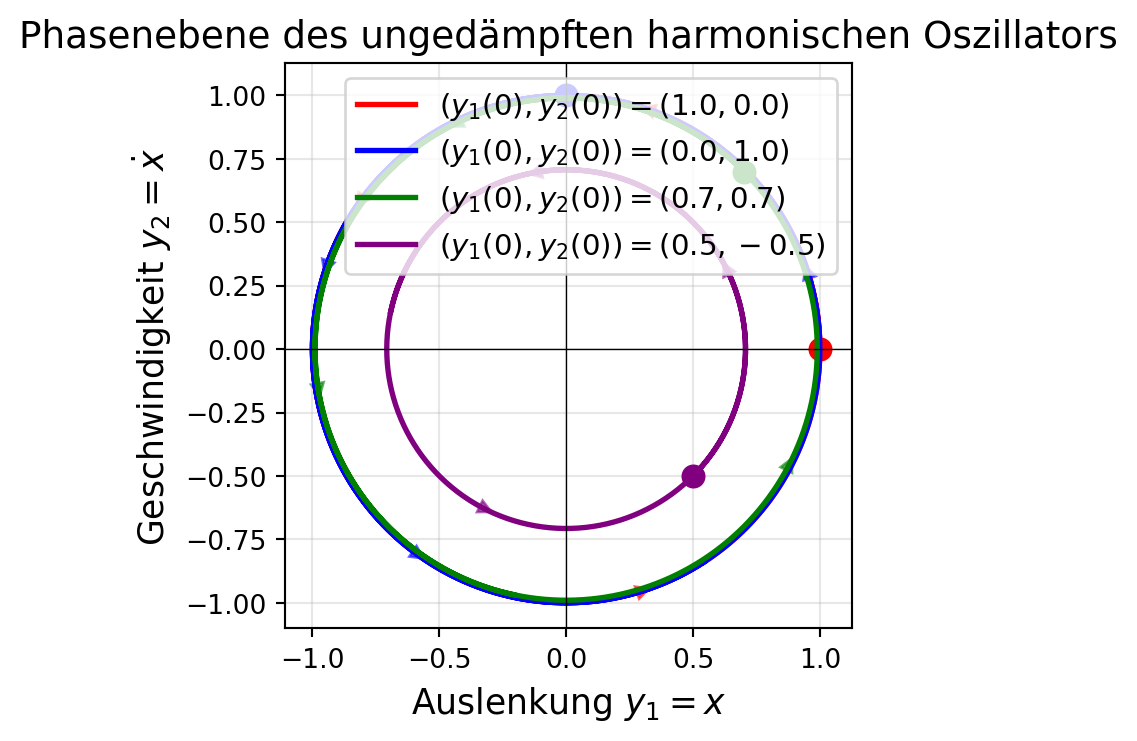
# Verschiedene Anfangsbedingungen
initial_conditions = [
(1.0, 0.0), # Maximale Ladung
(0.0, 1.0), # Maximaler Strom
(0.7, 0.7), # Diagonal
(0.5, -0.5), # Andere Richtung
]
t = np.linspace(0, 10, 1000)
colors = ['red', 'blue', 'green', 'purple']
for (Q0, I0), color in zip(initial_conditions, colors):
Q = Q0 * np.cos(omega_0 * t) - (I0 / omega_0) * np.sin(omega_0 * t)
I = Q0 * omega_0 * np.sin(omega_0 * t) + I0 * np.cos(omega_0 * t)
ax.plot(Q, I, color=color, linewidth=2, label=f'$(Q_0, I_0) = ({Q0}, {I0})$')
ax.plot(Q0, I0, 'o', color=color, markersize=8)
ax.set_xlabel('Ladung $Q(t)$ [C]', fontsize=12)
ax.set_ylabel('Strom $I(t)$ [A]', fontsize=12)
ax.set_title('LC-Schaltkreis (konservativ)', fontsize=12)
ax.grid(True, alpha=0.3)
ax.axhline(y=0, color='k', linewidth=0.5)
ax.axvline(x=0, color='k', linewidth=0.5)
ax.legend(fontsize=10, loc='upper right')
ax.set_aspect('equal')
# === Rechte Seite: RLC-Schaltkreis mit verschiedenen Dämpfungen ===
ax = axes[1]
L, C = 1.0, 1.0
omega_0 = 1.0 / np.sqrt(L * C)
# Für RLC-Schaltkreis (nur eine Subgrafik gezeigt)
R = 0.5 # Leichte Dämpfung für Demonstration
def rlc_circuit(t, y):
Q, I = y
dQ = I
dI = -(1 / (L * C)) * Q - (R / L) * I
return [dQ, dI]
initial_conditions = [
(1.0, 0.0),
(0.0, 1.5),
(0.7, 0.7),
(0.5, -1.0),
]
colors_rlc = plt.cm.viridis(np.linspace(0, 1, len(initial_conditions)))
for (Q0, I0), color in zip(initial_conditions, colors_rlc):
sol = solve_ivp(rlc_circuit, [0, 15], [Q0, I0], dense_output=True, max_step=0.01)
ax.plot(sol.y[0], sol.y[1], color=color, linewidth=2, alpha=0.8)
ax.plot(Q0, I0, 'o', color=color, markersize=8, label=f'$(Q_0, I_0) = ({Q0}, {I0})$')
ax.plot(0, 0, 'k*', markersize=15, label='Gleichgewicht')
ax.set_xlabel('Ladung $Q(t)$ [C]', fontsize=12)
ax.set_ylabel('Strom $I(t)$ [A]', fontsize=12)
ax.set_title(f'RLC-Schaltkreis mit Dämpfung (R={R})', fontsize=12)
ax.grid(True, alpha=0.3)
ax.axhline(y=0, color='k', linewidth=0.5)
ax.axvline(x=0, color='k', linewidth=0.5)
ax.legend(fontsize=9, loc='upper right')
ax.set_xlim([-1.2, 1.2])
ax.set_ylim([-1.5, 1.5])
plt.tight_layout()
plt.show()