import numpy as np
import matplotlib.pyplot as plt
from scipy.integrate import solve_ivp

# Parameter
alpha = 1.0  # Wachstumsrate Beute
beta = 0.5   # Prädationsrate
gamma = 1.0  # Sterberate Räuber
delta = 0.5  # Effizienz der Prädation

# Gleichgewicht
x_eq = gamma / delta
y_eq = alpha / beta

# System der Differentialgleichungen
def lotka_volterra(t, y):
    x, y_pred = y
    dx = alpha * x - beta * x * y_pred
    dy = delta * x * y_pred - gamma * y_pred
    return [dx, dy]

# Verschiedene Anfangsbedingungen
initial_conditions = [
    (0.5, 0.5),
    (1.0, 1.0),
    (2.0, 0.8),
    (0.8, 2.0),
]

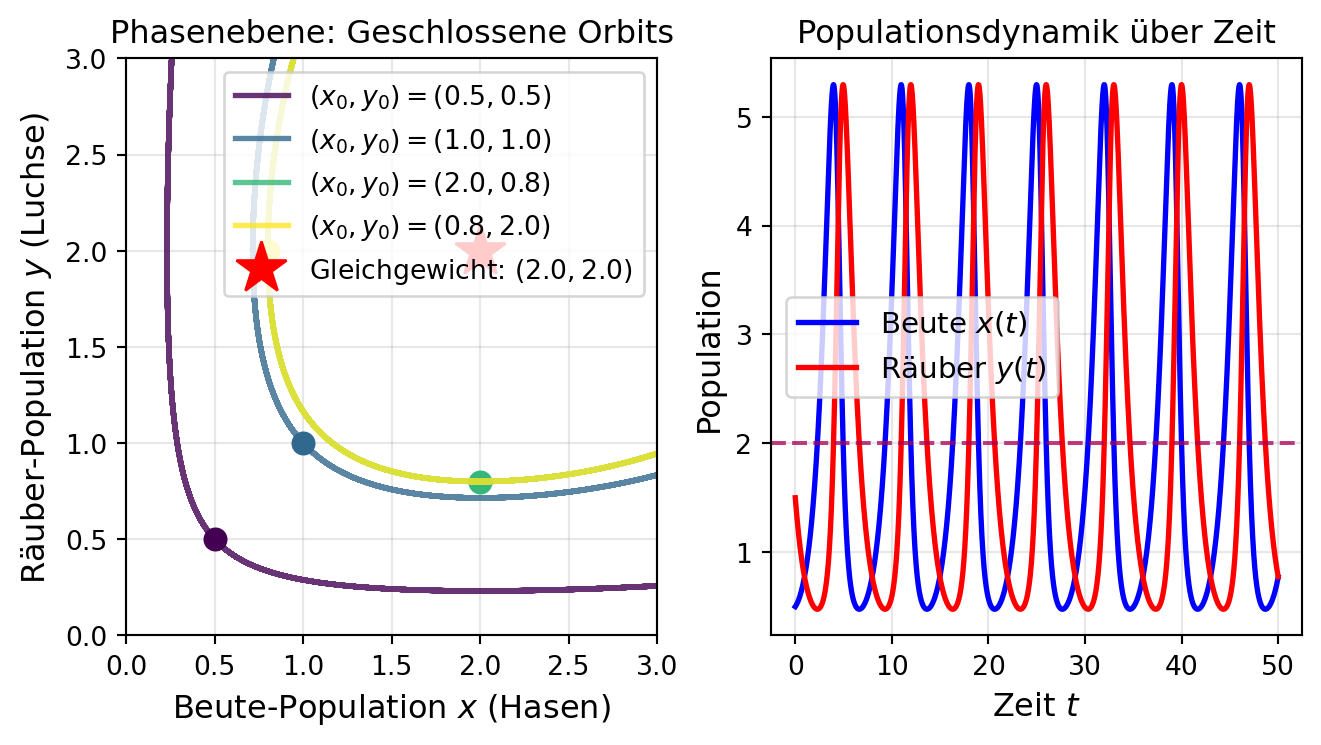
fig, axes = plt.subplots(1, 2, figsize=(7, 4))

# === Linke Seite: Phasenebene ===
ax = axes[0]
colors = plt.cm.viridis(np.linspace(0, 1, len(initial_conditions)))

for (x0, y0), color in zip(initial_conditions, colors):
    sol = solve_ivp(lotka_volterra, [0, 100], [x0, y0], dense_output=True, max_step=0.1)
    ax.plot(sol.y[0], sol.y[1], color=color, linewidth=2, alpha=0.8, label=f'$(x_0, y_0) = ({x0}, {y0})$')
    ax.plot(x0, y0, 'o', color=color, markersize=8)

# Nullklinen: dx/dt = 0 auf y = alpha/beta, dy/dt = 0 auf x = gamma/delta
ax.axhline(y=y_eq, color='gray', linestyle='--', linewidth=1.5,
           label=f'Nullkline $y = \\alpha/\\beta = {y_eq:.1f}$')
ax.axvline(x=x_eq, color='gray', linestyle='-.', linewidth=1.5,
           label=f'Nullkline $x = \\gamma/\\delta = {x_eq:.1f}$')

# Gleichgewichtspunkt
ax.plot(x_eq, y_eq, 'r*', markersize=20, label=f'Gleichgewicht: $({x_eq:.1f}, {y_eq:.1f})$')

ax.set_xlabel('Beute-Population $x$ (Hasen)', fontsize=12)
ax.set_ylabel('Räuber-Population $y$ (Luchse)', fontsize=12)
ax.set_title('Phasenebene: Geschlossene Orbits', fontsize=12)
ax.grid(True, alpha=0.3)
ax.legend(fontsize=8)
ax.set_xlim([0, 3])
ax.set_ylim([0, 3])

# === Rechte Seite: Zeitverlauf ===
ax = axes[1]
x0, y0 = 0.5, 1.5
sol = solve_ivp(lotka_volterra, [0, 50], [x0, y0], dense_output=True, max_step=0.01)

ax.plot(sol.t, sol.y[0], 'b-', linewidth=2, label='Beute $x(t)$')
ax.plot(sol.t, sol.y[1], 'r-', linewidth=2, label='Räuber $y(t)$')
ax.axhline(y=x_eq, color='b', linestyle='--', alpha=0.5)
ax.axhline(y=y_eq, color='r', linestyle='--', alpha=0.5)

ax.set_xlabel('Zeit $t$', fontsize=12)
ax.set_ylabel('Population', fontsize=12)
ax.set_title('Populationsdynamik über Zeit', fontsize=12)
ax.grid(True, alpha=0.3)
ax.legend(fontsize=11)

plt.tight_layout()
plt.show()