import numpy as np
import matplotlib.pyplot as plt

fig, ax = plt.subplots(figsize=(7, 4))

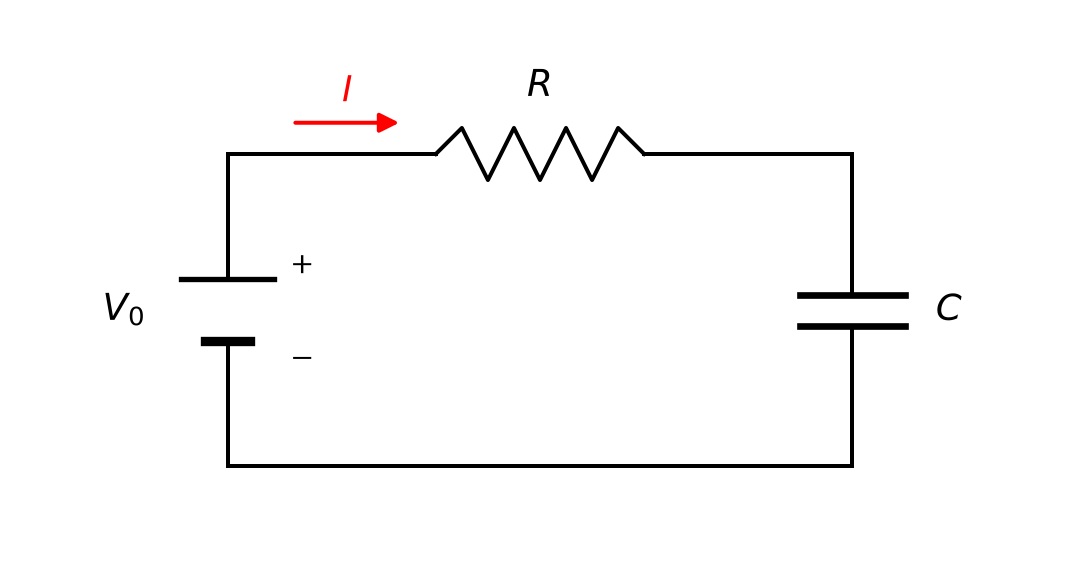
# Untere Leitung
ax.plot([0, 6], [0, 0], 'k', linewidth=1.5)

# Linke Leitung mit Spannungsquelle (Batteriesymbol)
ax.plot([0, 0], [0, 1.2], 'k', linewidth=1.5)
ax.plot([0, 0], [1.8, 3], 'k', linewidth=1.5)
ax.plot([-0.45, 0.45], [1.8, 1.8], 'k', linewidth=2)   # langer Strich (+)
ax.plot([-0.22, 0.22], [1.2, 1.2], 'k', linewidth=3.5)  # kurzer Strich (−)
ax.text(-1.2, 1.4, '$V_0$', fontsize=14)
ax.text(0.6, 1.85, '$+$', fontsize=11)
ax.text(0.6, 0.95, '$-$', fontsize=11)

# Obere Leitung mit Widerstand (Zickzack-Symbol)
ax.plot([0, 2], [3, 3], 'k', linewidth=1.5)
x_zz = np.linspace(2, 4, 9)
y_zz = 3 + 0.25 * np.array([0, 1, -1, 1, -1, 1, -1, 1, 0])
ax.plot(x_zz, y_zz, 'k', linewidth=1.5)
ax.plot([4, 6], [3, 3], 'k', linewidth=1.5)
ax.text(3, 3.55, '$R$', fontsize=14, ha='center')

# Rechte Leitung mit Kondensator (zwei parallele Platten)
ax.plot([6, 6], [3, 1.65], 'k', linewidth=1.5)
ax.plot([6, 6], [1.35, 0], 'k', linewidth=1.5)
ax.plot([5.5, 6.5], [1.65, 1.65], 'k', linewidth=2.5)
ax.plot([5.5, 6.5], [1.35, 1.35], 'k', linewidth=2.5)
ax.text(6.8, 1.4, '$C$', fontsize=14)

# Strompfeil I auf der oberen Leitung
ax.annotate('', xy=(1.7, 3.3), xytext=(0.6, 3.3),
            arrowprops=dict(arrowstyle='-|>', color='red', linewidth=1.5,
                            mutation_scale=15))
ax.text(1.1, 3.5, '$I$', fontsize=13, color='red')

ax.set_xlim(-2, 8)
ax.set_ylim(-0.8, 4.3)
ax.set_aspect('equal')
ax.axis('off')
plt.show()