import numpy as np
import matplotlib.pyplot as plt

fig, axes = plt.subplots(1, 2, figsize=(7, 4))

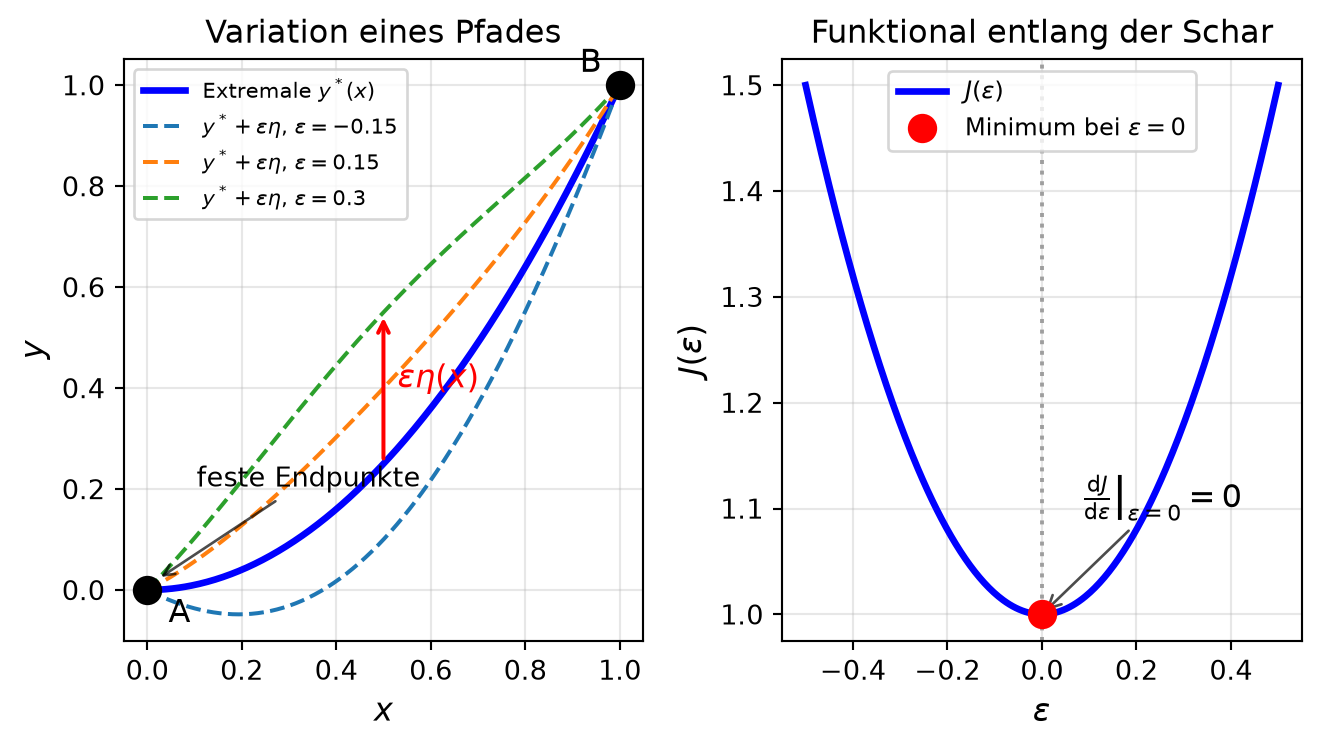
# === Linke Seite: Extremale und gestörte Kurven ===
ax = axes[0]
x = np.linspace(0, 1, 300)

# Extremale: glatte Kurve zwischen A = (0, 0) und B = (1, 1)
y_star = x**2

# Störungsfunktion, verschwindet an den Endpunkten
eta = np.sin(np.pi * x)

ax.plot(x, y_star, 'b-', linewidth=2.5, label='Extremale $y^*(x)$')
for eps in [-0.15, 0.15, 0.3]:
    ax.plot(x, y_star + eps * eta, '--', linewidth=1.5,
            label=f'$y^* + \\varepsilon\\eta$, $\\varepsilon = {eps}$')

# Feste Endpunkte
ax.plot([0, 1], [0, 1], 'ko', markersize=10, zorder=5)
ax.annotate('A', (0, 0), textcoords='offset points', xytext=(8, -12), fontsize=12)
ax.annotate('B', (1, 1), textcoords='offset points', xytext=(-15, 5), fontsize=12)
ax.annotate('feste Endpunkte', (0.02, 0.02), textcoords='offset points',
            xytext=(15, 35), fontsize=10,
            arrowprops=dict(arrowstyle='->', color='black', alpha=0.7))

# Pfeil für die Störung epsilon * eta(x)
x_a = 0.5
ax.annotate('', xy=(x_a, x_a**2 + 0.3 * np.sin(np.pi * x_a)),
            xytext=(x_a, x_a**2),
            arrowprops=dict(arrowstyle='->', color='red', linewidth=1.5))
ax.text(x_a + 0.03, x_a**2 + 0.15, '$\\varepsilon\\eta(x)$', color='red', fontsize=12)

ax.set_xlabel('$x$', fontsize=12)
ax.set_ylabel('$y$', fontsize=12)
ax.set_title('Variation eines Pfades', fontsize=12)
ax.grid(True, alpha=0.3)
ax.legend(fontsize=8, loc='upper left')

# === Rechte Seite: Funktional entlang der Variation ===
ax = axes[1]
eps = np.linspace(-0.5, 0.5, 300)
J0 = 1.0
J = J0 + 2.0 * eps**2  # Parabel mit Minimum bei eps = 0

ax.plot(eps, J, 'b-', linewidth=2.5, label='$J(\\varepsilon)$')
ax.plot(0, J0, 'ro', markersize=10, zorder=5, label='Minimum bei $\\varepsilon = 0$')
ax.axvline(x=0, color='gray', linestyle=':', alpha=0.7)
ax.annotate('$\\left.\\frac{\\mathrm{d}J}{\\mathrm{d}\\varepsilon}\\right|_{\\varepsilon=0} = 0$',
            (0, J0), textcoords='offset points', xytext=(15, 40), fontsize=12,
            arrowprops=dict(arrowstyle='->', color='black', alpha=0.7))

ax.set_xlabel('$\\varepsilon$', fontsize=12)
ax.set_ylabel('$J(\\varepsilon)$', fontsize=12)
ax.set_title('Funktional entlang der Schar', fontsize=12)
ax.grid(True, alpha=0.3)
ax.legend(fontsize=9, loc='upper center')

plt.tight_layout()
plt.show()