import numpy as np
import matplotlib.pyplot as plt

fig, ax = plt.subplots(figsize=(7, 4))
ax.axis('off')
ax.set_xlim(0, 14)
ax.set_ylim(0, 8)
ax.set_aspect('equal')

lw = 1.5
col = 'k'

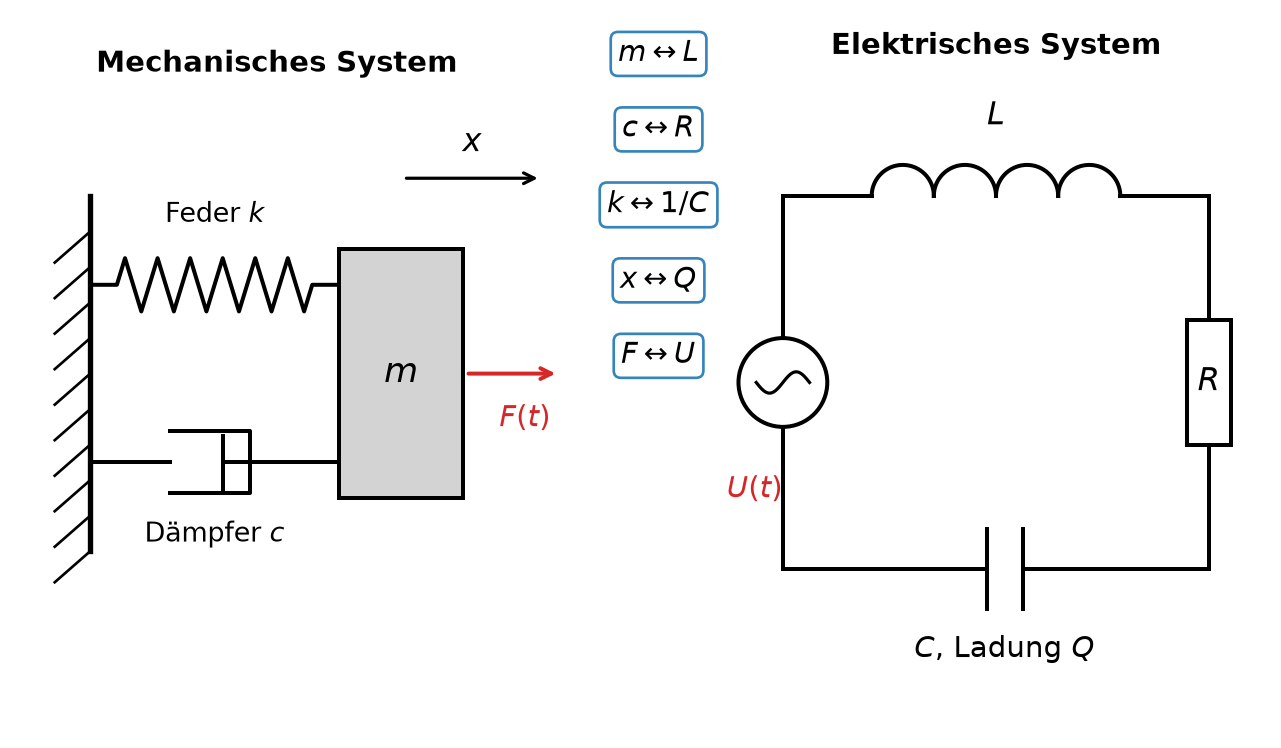
# --- Linke Seite: Feder-Masse-Dämpfer-System ---

# Wand mit Schraffur
ax.plot([0.8, 0.8], [2.0, 6.0], color=col, lw=2)
for y in np.arange(2.0, 6.0, 0.4):
    ax.plot([0.8, 0.4], [y, y - 0.35], color=col, lw=1)

# Feder (Zickzack) von der Wand zur Masse, obere Linie
def feder(ax, x0, x1, y, n=6, h=0.3):
    xs = [x0, x0 + 0.3]
    ys = [y, y]
    dx = (x1 - x0 - 0.6) / (2 * n)
    for i in range(2 * n):
        xs.append(x0 + 0.3 + (i + 0.5) * dx)
        ys.append(y + h if i % 2 == 0 else y - h)
    xs += [x1 - 0.3, x1]
    ys += [y, y]
    ax.plot(xs, ys, color=col, lw=lw)

feder(ax, 0.8, 3.6, 5.0)
ax.text(2.2, 5.7, 'Feder $k$', ha='center', fontsize=10)

# Dämpfer (Zylinder mit Kolben), untere Linie
yd = 3.0
ax.plot([0.8, 1.7], [yd, yd], color=col, lw=lw)            # Stange links
ax.plot([1.7, 2.6, 2.6, 1.7], [yd + 0.35, yd + 0.35, yd - 0.35, yd - 0.35],
        color=col, lw=lw)                                   # offener Zylinder
ax.plot([2.3, 2.3], [yd + 0.3, yd - 0.3], color=col, lw=lw) # Kolben
ax.plot([2.3, 3.6], [yd, yd], color=col, lw=lw)             # Stange rechts
ax.text(2.2, 2.1, 'Dämpfer $c$', ha='center', fontsize=10)

# Masse (Rechteck)
ax.add_patch(plt.Rectangle((3.6, 2.6), 1.4, 2.8, fill=True,
                           facecolor='lightgray', edgecolor=col, lw=lw))
ax.text(4.3, 4.0, '$m$', ha='center', va='center', fontsize=13)

# Koordinate x (Pfeil)
ax.annotate('', xy=(5.9, 6.2), xytext=(4.3, 6.2),
            arrowprops=dict(arrowstyle='->', color=col, lw=1.2))
ax.text(5.1, 6.5, '$x$', ha='center', fontsize=12)

# Externe Kraft F
ax.annotate('', xy=(6.1, 4.0), xytext=(5.0, 4.0),
            arrowprops=dict(arrowstyle='->', color='C3', lw=1.5))
ax.text(5.7, 3.4, '$F(t)$', ha='center', fontsize=11, color='C3')

# --- Rechte Seite: Serien-RLC-Kreis ---
xl, xr, yb, yt = 8.6, 13.4, 1.8, 6.0

# Spule L (obere Kante): Halbkreisbögen
ax.plot([xl, 9.6], [yt, yt], color=col, lw=lw)
theta = np.linspace(0, np.pi, 50)
for i in range(4):
    xc = 9.6 + 0.35 + i * 0.7
    ax.plot(xc + 0.35 * np.cos(theta), yt + 0.35 * np.sin(theta), color=col, lw=lw)
ax.plot([9.6 + 4 * 0.7, xr], [yt, yt], color=col, lw=lw)
ax.text(11.0, 6.8, '$L$', ha='center', fontsize=12)

# Widerstand R (rechte Kante): Rechteck-Symbol
ax.plot([xr, xr], [yt, 4.6], color=col, lw=lw)
ax.add_patch(plt.Rectangle((xr - 0.25, 3.2), 0.5, 1.4, fill=False,
                           edgecolor=col, lw=lw))
ax.plot([xr, xr], [3.2, yb], color=col, lw=lw)
ax.text(xr, 3.9, '$R$', ha='center', va='center', fontsize=12)

# Kondensator C (untere Kante): zwei parallele Platten
ax.plot([xr, 11.3], [yb, yb], color=col, lw=lw)
ax.plot([11.3, 11.3], [yb - 0.45, yb + 0.45], color=col, lw=lw)
ax.plot([10.9, 10.9], [yb - 0.45, yb + 0.45], color=col, lw=lw)
ax.plot([10.9, xl], [yb, yb], color=col, lw=lw)
ax.text(11.1, 0.8, '$C$, Ladung $Q$', ha='center', fontsize=11)

# Spannungsquelle U (linke Kante): Kreis mit ~
ax.plot([xl, xl], [yb, 3.4], color=col, lw=lw)
circ = plt.Circle((xl, 3.9), 0.5, fill=False, edgecolor=col, lw=lw)
ax.add_patch(circ)
ts = np.linspace(-0.3, 0.3, 50)
ax.plot(xl + ts, 3.9 + 0.12 * np.sin(ts / 0.3 * np.pi), color=col, lw=1.2)
ax.plot([xl, xl], [4.4, yt], color=col, lw=lw)
ax.text(8.6, 2.6, '$U(t)$', ha='right', fontsize=11, color='C3')

# --- Zuordnungspfeile in der Mitte ---
pairs = ['$m \\leftrightarrow L$',
         '$c \\leftrightarrow R$',
         '$k \\leftrightarrow 1/C$',
         '$x \\leftrightarrow Q$',
         '$F \\leftrightarrow U$']
for i, p in enumerate(pairs):
    ax.text(7.2, 7.6 - i * 0.85, p, ha='center', va='center', fontsize=11,
            bbox=dict(boxstyle='round,pad=0.25', facecolor='white',
                      edgecolor='C0', alpha=0.9))

ax.text(2.9, 7.4, 'Mechanisches System', ha='center', fontsize=11,
        fontweight='bold')
ax.text(11.0, 7.6, 'Elektrisches System', ha='center', fontsize=11,
        fontweight='bold')

plt.tight_layout()
plt.show()